Reducing Piles to Reduce Carbon Footprint
Authors: Kumar Allady, P.E., CEO of Smart Infrastructure Group and Sastry Putcha, Ph.D., P.E., vice president, Smart Structures
The Florida Department of Transportation District Six planned improvements to State Road 968/Southwest First Street in Miami-Dade County, Florida. The proposed improvements included replacing the existing four-lane, oneway bascule bridge built in 1929 over the Miami River with a new three-lane, one-way bascule bridge. Most of the bridge is supported by 24 in (61 cm), square precast/prestressed concrete (PPC) driven piles and with micropiles at end bent one. To minimize the construction materials, the bridge foundation is designed for a resistance factor of 0.75. With that design approach, the total piles for the project were 72 for pier two, 73 piles for pier three, 22 piles for end bent four and 15 piles for the control house.
The Challenge
Traditionally, sustainability of infrastructure is said to occur when environmental, economic and social factors find common ground during its lifecycle, which also results in economic, safe and accelerated construction. But how can “Joe Public” or, say, the administrators of public transportation departments who provide funding and monitor public safety, assess the sustainability of foundations that are buried and thus out of view? After all, sustainability includes reductions in carbon footprint and this is hard to determine when the product is out of sight.
The Solution
An easy solution to reduce the carbon footprint for deep foundations is when lesser quantities of concrete and steel are needed by applying a higher resistance factor. This is very feasible with 100 percent testing of piles in a project. For prestressed concrete piles this has become practical with embedded data collector (EDC) technology, which consists of sensors embedded at the pile tip, pile top and any other appropriate locations.
EDC, as described above, also accurately determines the tip and skin resistance from which the capacity — even the uplift capacity — can be assessed. Applying this approach has two advantages: it reduces the use of construction materials because of the higher resistance factor and it provides monitoring data in real time for every pile as it is driven.
The Results
All the PPC piles were 100 percent dynamically tested using EDC. When compared to a traditional design based on a resistance factor of 0.65 the number of piles were reduced by approximately 15 percent, reducing the carbon footprint by a similar percentage as shown in Table 1.
Using the EFFC/DFI Carbon Calculator V4.0, the CO2 emissions were calculated to be 630 tCO2e for the scenario with a resistance factor of 0.65, and 540 tCO2e for the scenario with a resistance factor 0.75. The reduction in CO2 emissions is equivalent to what is shown in Table 1.
| State Road 968/Southwest First Street Bridge | Traditional (0.65) | EDC (0.75) | Difference |
|---|---|---|---|
| Total number of piles | 209 | 182 | 15% |
| Total linear feet of piles | 14,605 | 12,700 | 15% |
| Total concrete used for piles (cubic feet) | 58,420 | 50,800 | 15.0% |
| Total greenhouse gas emissions (tCO2e) | 630 | 540 | 16.7% |
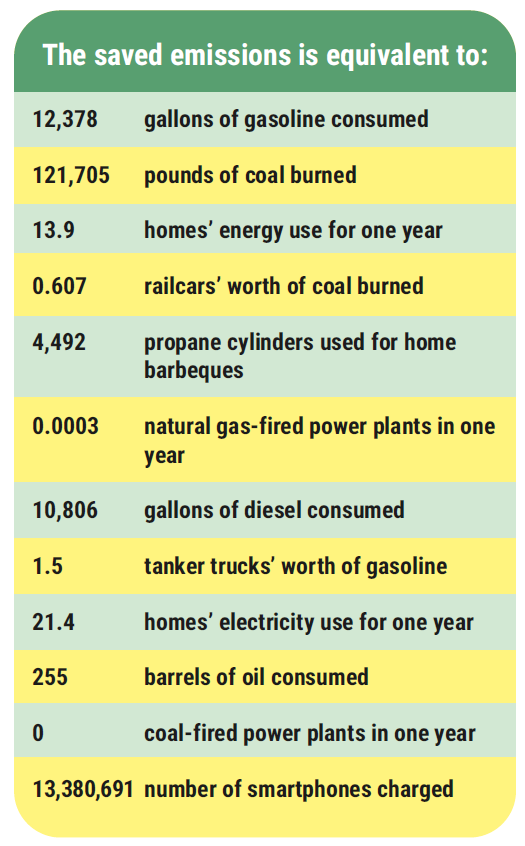
Use the EFFC/DFI Carbon Calculator and the EPA’s carbon equivalency tool to figure out the impact of your carbon-reducing efforts on your next project!